
What Makes a Driver Good Value in F1 Fantasy?
Value in F1 Fantasy isn't about who scores the most points. It's about who scores the most points relative to their price. A $25M driver who scores 20 points per race has a PPM (Points Per Million) of 0.80. A $12M driver who scores 12 points per race has a PPM of 1.00. The cheaper driver is better value because they deliver more fantasy points per dollar of budget consumed.
PPM is the universal metric for comparing drivers across price tiers. It tells you whether a driver is earning their price tag, outperforming it, or costing you budget that could be better spent elsewhere.
TL;DR: The best value F1 Fantasy picks aren't the most expensive drivers. They're the ones with the highest Points Per Million (PPM). Target drivers priced $12-18M who consistently deliver 1.0+ PPM. These budget picks free up cap space for one or two premium drivers while maintaining competitive weekly scores. Check the Statistics page for live PPM rankings updated after every race.
How Is Points Per Million (PPM) Calculated?
PPM divides a driver's fantasy points by their current price in millions:
PPM = Fantasy Points / Price in Millions
For a single race: a driver priced at $15M who scores 18 points has a PPM of 18/15 = 1.20.
For season averages: sum all race points, divide by (price × number of races). Season PPM smooths out individual race variance and gives a more reliable picture of a driver's true value.
The PPM thresholds that trigger price changes are:
- 1.2+ PPM: Maximum price rise
- 0.9-1.19 PPM: Small price rise
- 0.6-0.89 PPM: Small price drop
- Below 0.6 PPM (Tier A) / Below 0.4 (Tier B): Maximum price drop
A driver consistently above 1.0 PPM is earning more than their price suggests. They're underpriced by the market and represent genuine value.
How to Find Hidden Gems Early in the Season
The best time to find value picks is the first 3-4 races, before prices adjust to reflect actual performance. Here's what to look for:
Drivers Who Changed Teams
A driver moving to a stronger team often starts the season underpriced because their F1 Fantasy price is based on last season's performance with their old team. If the new car is significantly better, their points output jumps while their price lags behind. This PPM gap can last 3-5 races before price rises close it.
Midfield Drivers With Car Upgrades
Teams introduce upgrades throughout the season. When a midfield team brings a significant aero or power unit update, their drivers suddenly qualify and race higher. But their F1 Fantasy price still reflects pre-upgrade performance. These are some of the best value picks because the performance improvement is real but the price hasn't caught up.
Consistent Points Scorers Outside the Top 10
Some drivers consistently finish P11-P14 in the race. They score 0 race points (only P1-P10 earn points) but accumulate fantasy points through qualifying (if they reach Q3), positions gained, overtakes, and occasionally fastest lap. At $10-14M, these drivers can deliver 0.8-1.0 PPM, which is solid value.
Drivers Returning From Bad Luck
A driver who DNF'd or had penalties in recent races has depressed PPM and possibly a reduced price. If the bad luck was mechanical (not pace-related), they're likely to revert to their normal scoring once reliability returns. Buy the dip.
The Value Tier System: How to Structure Your Team
The best F1 Fantasy teams aren't five premium drivers. They're a mix of tiers that maximizes total team points within the $100M cap:
Tier 1: Premium Anchors ($22M+)
Pick 1-2 premium drivers who are virtually guaranteed top-5 finishes every race. These are your DRS Boost candidates. Their PPM might be "only" 0.8-0.9 because their high price makes the denominator large, but the raw points are essential for competitive weekly scores.
What to look for: Season-long consistency, low DNF rate, strong qualifying pace.
Tier 2: Value Sweet Spot ($15-21M)
Pick 2-3 drivers in this range. This is where the best PPM drivers typically live. They're good enough to score double-digit fantasy points regularly but priced low enough that their PPM stays above 1.0.
What to look for: Drivers in strong cars who aren't the team leader (often the "number two" driver), or drivers in competitive midfield teams that consistently fight for P5-P10.
Tier 3: Budget Enablers ($10-14M)
Pick 0-1 budget drivers whose low price frees up cap space for your premium picks. These drivers won't score big, but at 6-10 points per race with a $10M price, their PPM can be reasonable.
What to look for: Backmarker team drivers who are consistently faster than their teammate (they'll pick up positions-gained points regularly). Avoid drivers who frequently DNF, as the -20 penalty on a budget driver destroys their PPM for weeks.
Example Team Structure
| Slot | Price Range | Role | PPM Target |
|---|---|---|---|
| Driver 1 (DRS Boost) | $24-28M | Points anchor | 0.8+ |
| Driver 2 | $20-24M | Secondary scorer | 0.9+ |
| Driver 3 | $16-19M | Value pick | 1.0+ |
| Driver 4 | $14-17M | Value/growth pick | 1.0+ |
| Driver 5 | $10-14M | Budget enabler | 0.7+ |
| Constructor 1 | $18-25M | Points anchor | — |
| Constructor 2 | $12-18M | Value pick | — |
| Total | $100M |
This structure puts roughly 50% of your budget into 2 premium drivers (your scoring floor) and 50% into 3 value picks (your PPM advantage).
What PPM Should You Target for Each Price Range?
Here are realistic PPM benchmarks by price tier:
| Price Range | Good PPM | Great PPM | Warning PPM |
|---|---|---|---|
| $24M+ | 0.80+ | 0.95+ | Below 0.65 |
| $19-23M | 0.85+ | 1.00+ | Below 0.70 |
| $15-18M | 0.95+ | 1.15+ | Below 0.75 |
| $10-14M | 0.80+ | 1.00+ | Below 0.50 |
Drivers below the "Warning" threshold are actively costing you points. They're consuming budget that would score more on a cheaper alternative. Don't let emotional attachment keep an underperforming driver on your team.
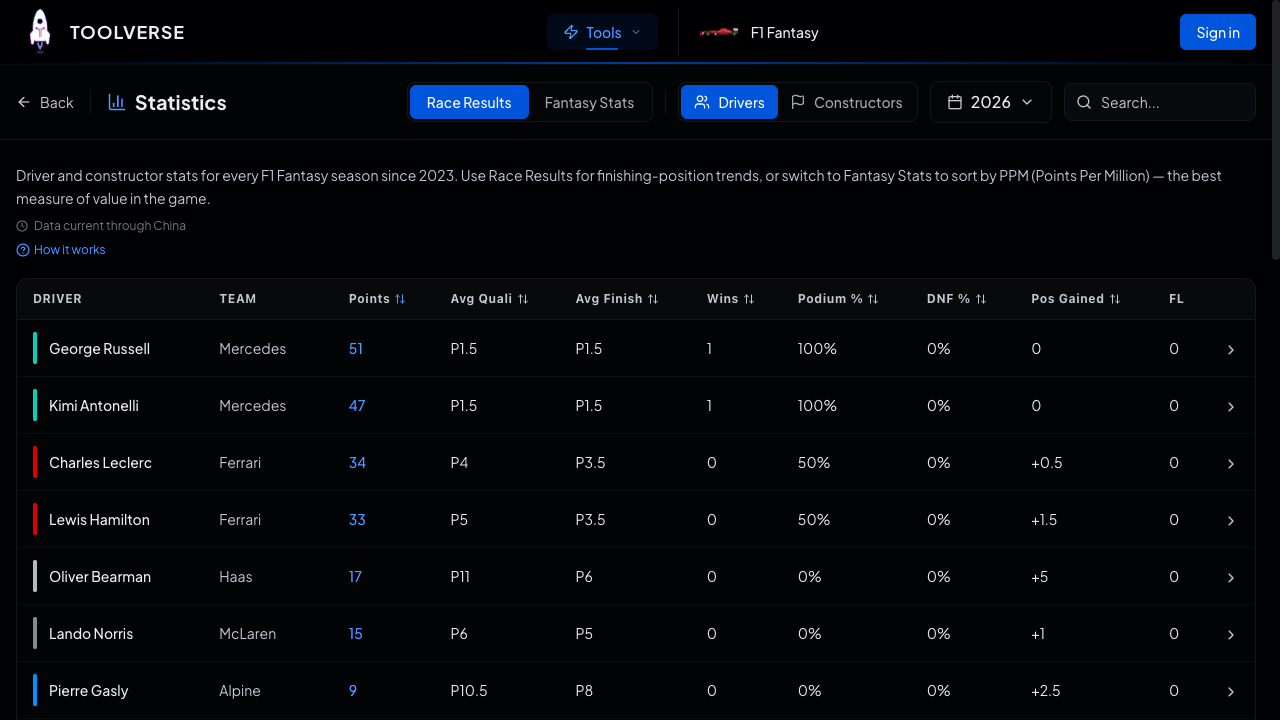
The Statistics page shows live PPM rankings for every driver and constructor, updated after each race.
How to Spot Overpriced Drivers
Not every expensive driver is worth their price. Watch for these red flags:
PPM below 0.7 for 3+ consecutive races. A premium driver ($22M+) who consistently scores below 15 points per race is overpriced. Their budget would be better split between two value picks who combine for more total points.
Falling price trend. Check the Standings page for price history. A driver whose price has dropped 3+ races in a row is in a performance slump. The market is correcting their overvaluation. Sell before more value erodes.
Team regression. If a constructor's car has fallen behind due to development struggles, both their drivers become overpriced simultaneously. This is harder to spot because individual race results can vary, but if both teammates are underperforming PPM benchmarks, the car is the problem.
Post-contract announcement. Drivers who've announced they're leaving a team sometimes see reduced team support (fewer favorable strategies, older parts). This isn't universal, but it's worth monitoring if a driver's results dip after a team change announcement.
Constructor Value: Don't Overlook the Teams
Constructors follow the same PPM logic as drivers, but with additional scoring from teamwork bonuses (up to +10 per race) and pit stop points (up to +20 per race). This makes top constructors disproportionately valuable.
A top constructor earning +10 teamwork and +15 pit stop points consistently adds 25 bonus points per race that have nothing to do with race results. Over a 24-race season, that's 600 points from bonuses alone.
Value constructor picks: Midfield teams that regularly get both drivers into Q3 (+10 teamwork) but are priced at $14-16M instead of $22M+. They won't match the pit stop points of Red Bull or McLaren, but the teamwork bonus makes them excellent PPM picks.
How to Use the Statistics Dashboard for Value Analysis
The Statistics page provides all the data you need for value analysis:
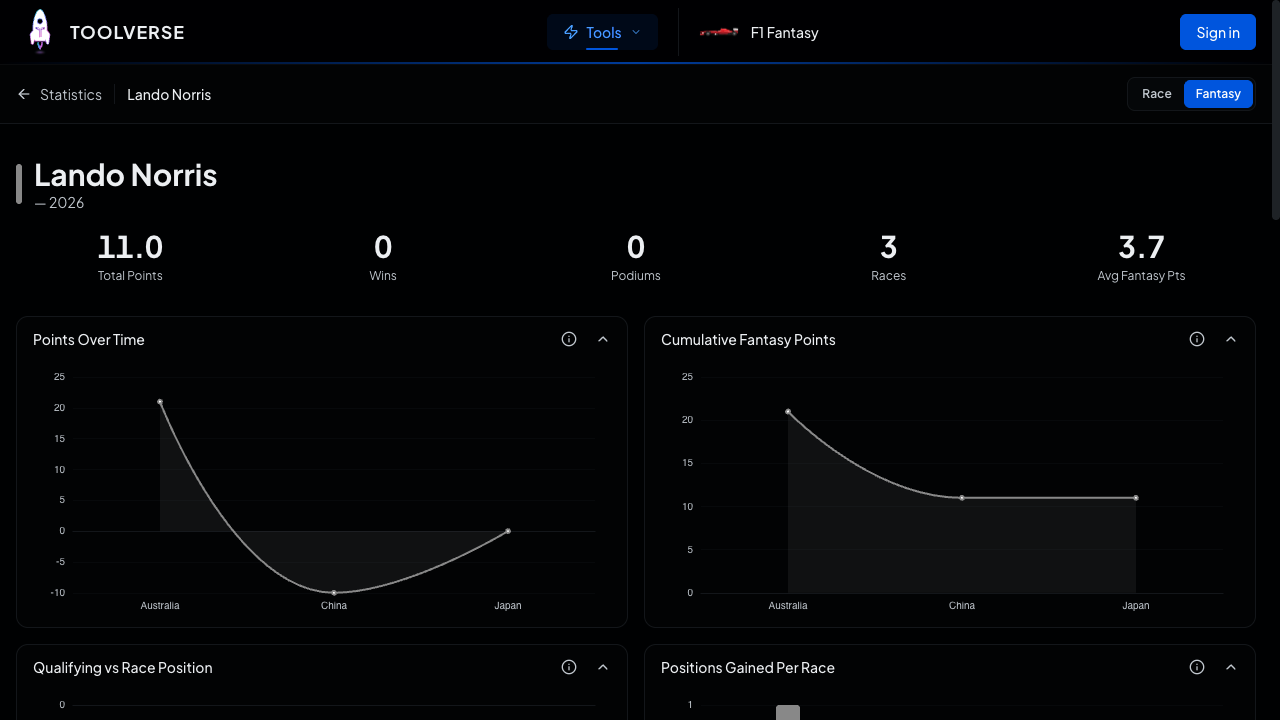
Fantasy Points tab: See per-race scoring breakdowns. Identify which categories each driver scores most from (qualifying? overtakes? positions gained?). Drivers who score heavily from positions gained are often underpriced because they start lower than they finish.
Driver profiles: Click any driver for deep analytics including consistency heatmaps, teammate comparisons, and track-type performance. A driver who consistently outperforms at upcoming track types is an anticipatory value pick.
Constructor profiles: Compare constructor scoring by component. Which constructors earn the most from teamwork? Which have the fastest pit stops? These consistent bonus categories are more predictable than race results.
Frequently Asked Questions
Should I always pick the highest PPM drivers?
Not necessarily. PPM is a guide, not an absolute rule. A driver with 1.3 PPM at $10M scores only 13 points per race, while a driver with 0.85 PPM at $25M scores 21 points. The premium driver scores more raw points. The optimal team blends high-PPM value picks with raw-scoring premium picks to maximize total points within the budget.
How often should I check PPM rankings?
Check after every race. PPM changes weekly as new results enter the rolling window and old ones drop off. A driver who was great value in Races 1-3 might become average value by Race 6 if their results stabilize while their price rises.
Can a driver be good value even with a low PPM?
Rarely, but yes. If a driver has a low season-average PPM but you expect a significant improvement (car upgrade, favorable track cluster, return from injury), buying them before the improvement is a form of value investing. Their current PPM is backward-looking; your thesis is forward-looking.
What's the best way to compare two drivers at different prices?
Calculate the points gap: how many more points does the expensive driver score per race? Then calculate the budget freed: how much cap space does the cheaper driver save? If that saved budget, redistributed elsewhere on your team, generates more extra points than the gap, the cheaper driver wins.
Do driver profiles on Toolverse show PPM?
Yes. Each driver's profile on the Statistics page includes their current PPM, PPM trend, and how they compare to others in their price range. Constructor profiles show similar value metrics.
Find Your Value Picks
Value analysis is the foundation of competitive F1 Fantasy play. Check the Statistics page for live PPM rankings, use the Budget Boost page to find drivers about to rise in price, and run the Apex Team Optimizer to find the best team within your budget. For the full primer on how prices change, read our price changes guide. New to the game? Start with our beginner's guide.